Mobiliti

Regional Scale Transportation Network Simulation with game-changing possibilities and practical impacts.

mobiliti: AN Overview

How well does Mobiliti scale?

At the center of our work is Mobiliti, the cutting-edge software system that accurately simulates the movement of an entire population through a region’s road networks. 

Unlike traditional simulation capabilities, Mobiliti is able to handle the incredible volume of data that comes with modeling millions of trips across an entire metropolitan system.

San Francisco Bay Area

Population of over 8 million

19M vehicle trips in a day

1M link network

Day’s worth of trips simulated in under: 

4 Minutes

Los Angeles Basin

Population of over 9.8 million

40M vehicle trips in a day

2M link network

Day’s worth of trips simulated in under: 

6 Minutes

quote marks

The future of transportation management lies not only in understanding the intertwined nature of urban challenges, but also in proactively managing them—and that takes high-performance computing, quantitative modeling of transportation networks, and deep knowledge in urban mobility.

Dr. Jane Macfarlane

Director, Smart Cities Research Center

Methodology

Mobiliti is an High Performance Computing (HPC) simulation platform that uses Parallel Discrete Event Simulation (PDES), parallel traffic assignment algorithms, and AI/ML modeling, specifically graph neural networks for traffic forecasting. It produces large data sets with individual network link and vehicle-level metrics.

diagram of the core algorithms in Mobiliti

Practical Applications

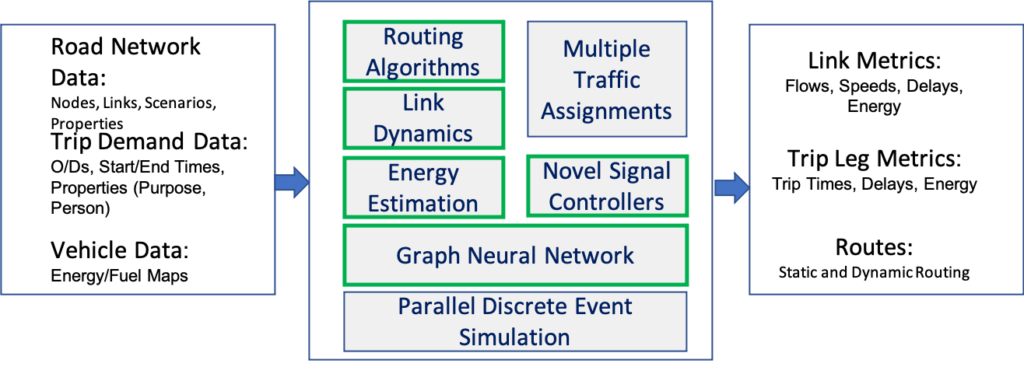
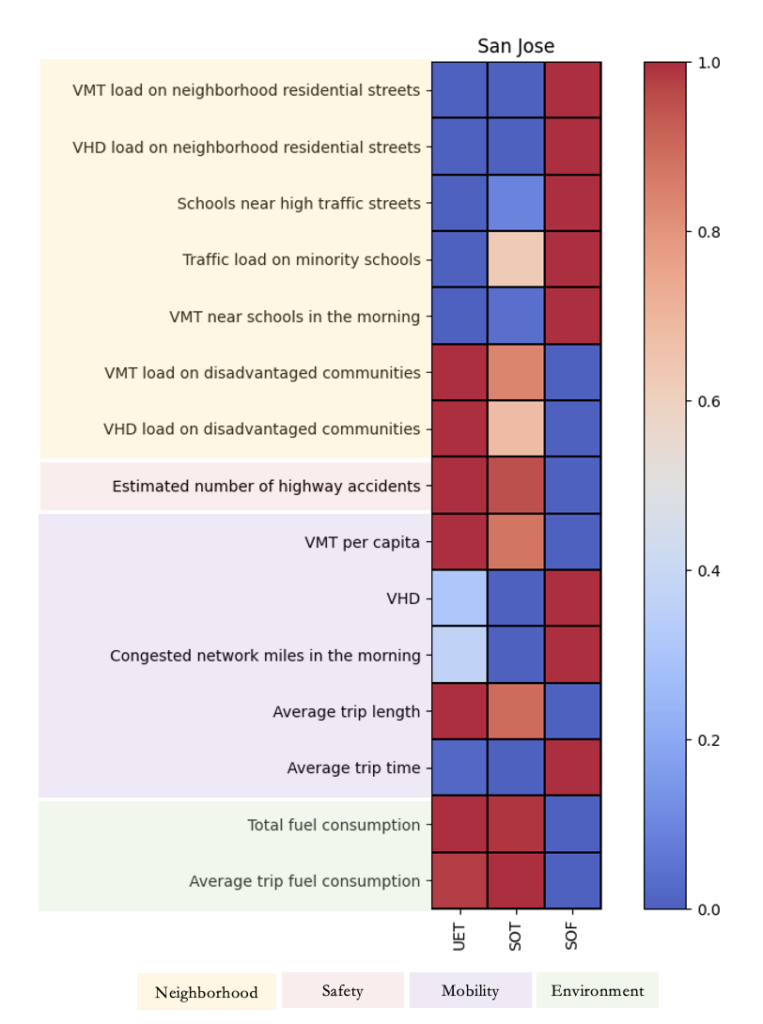
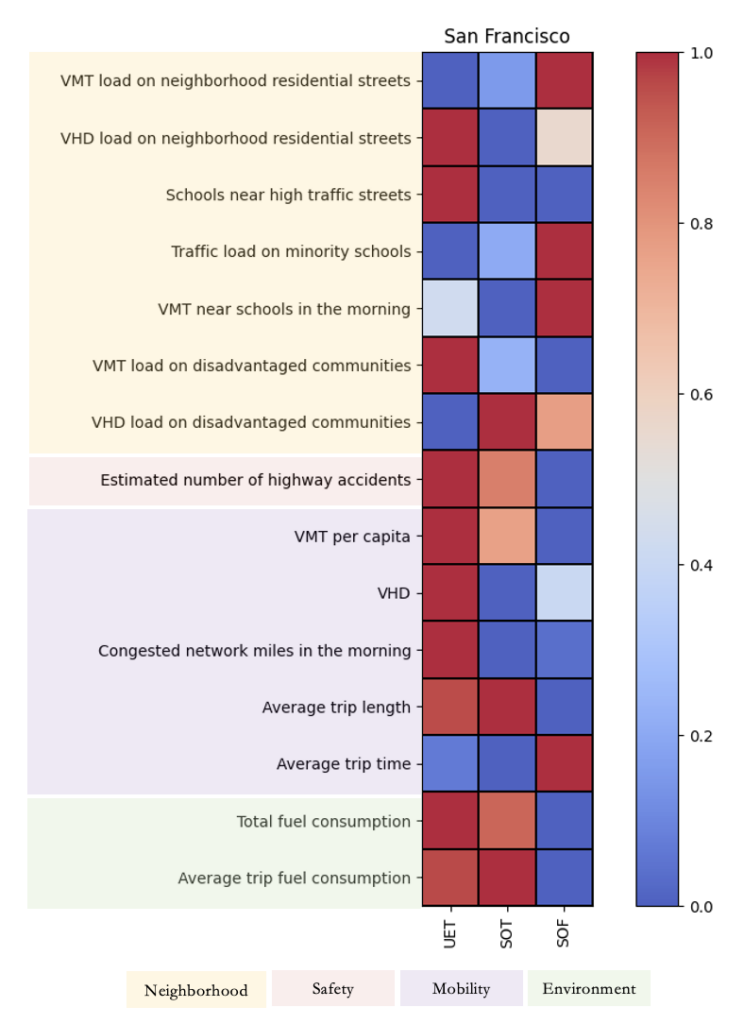
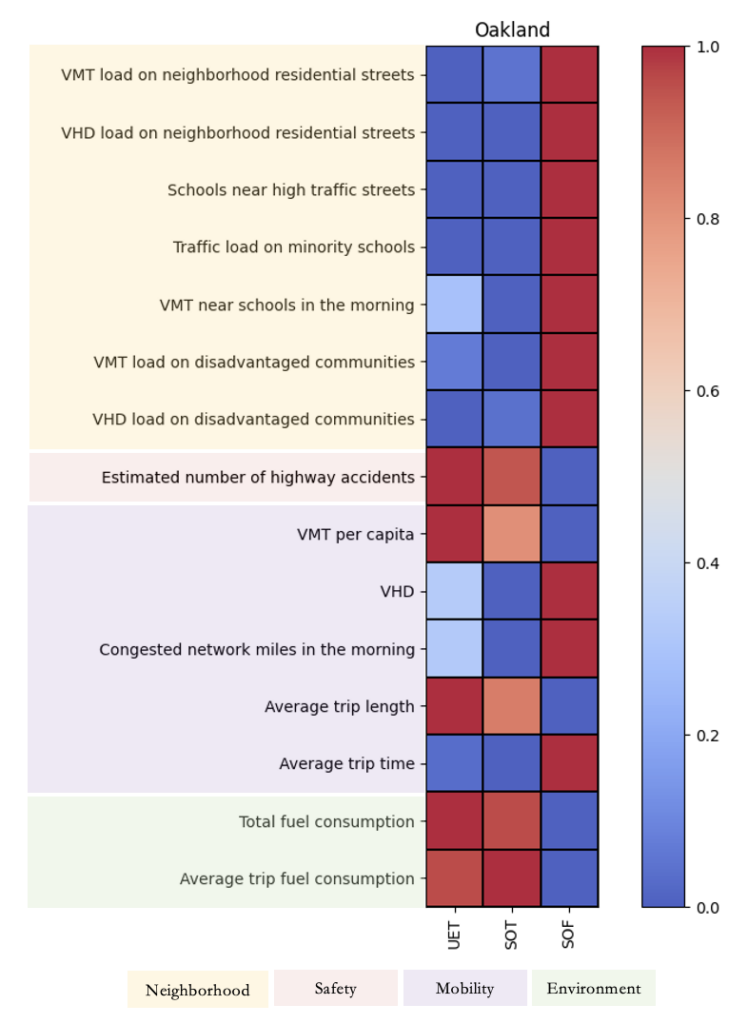
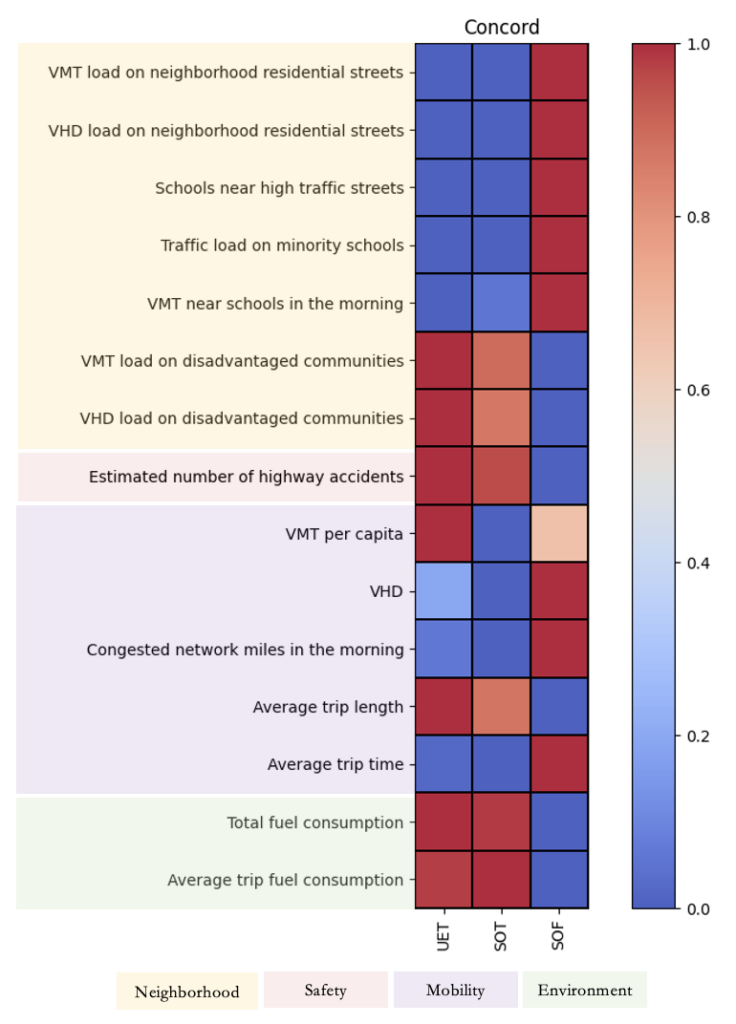
Our simulations generate results that can be used by large metropolitan regions to solve pertinent challenges in regional transportation planning. The models use the SFCTA Champ 6 model for travel demand. 

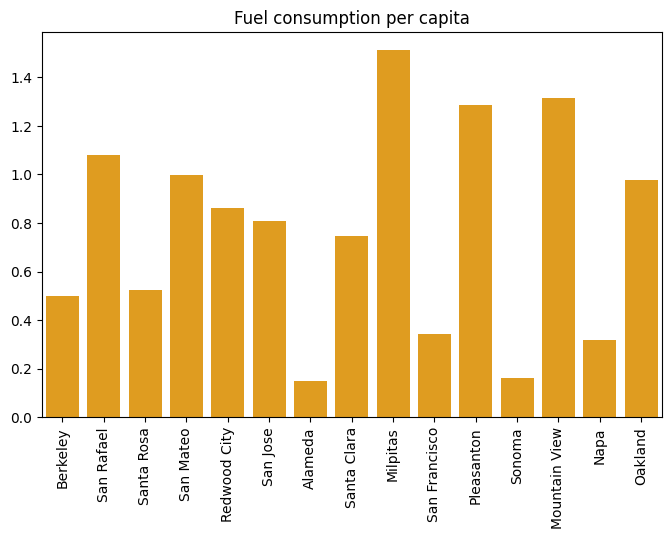
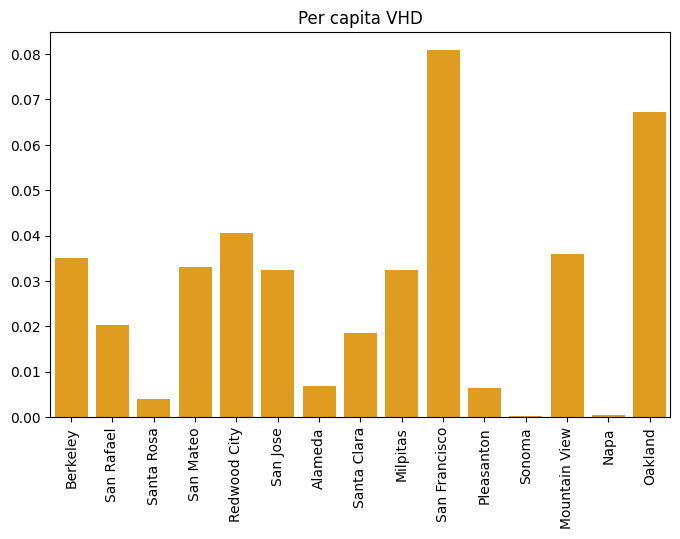
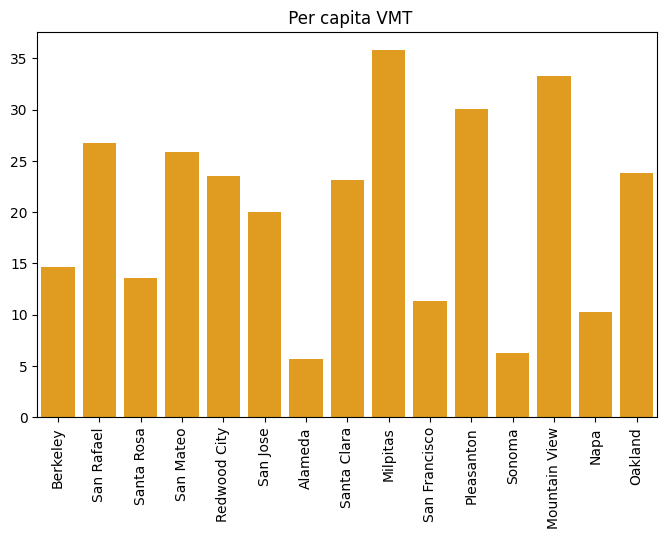
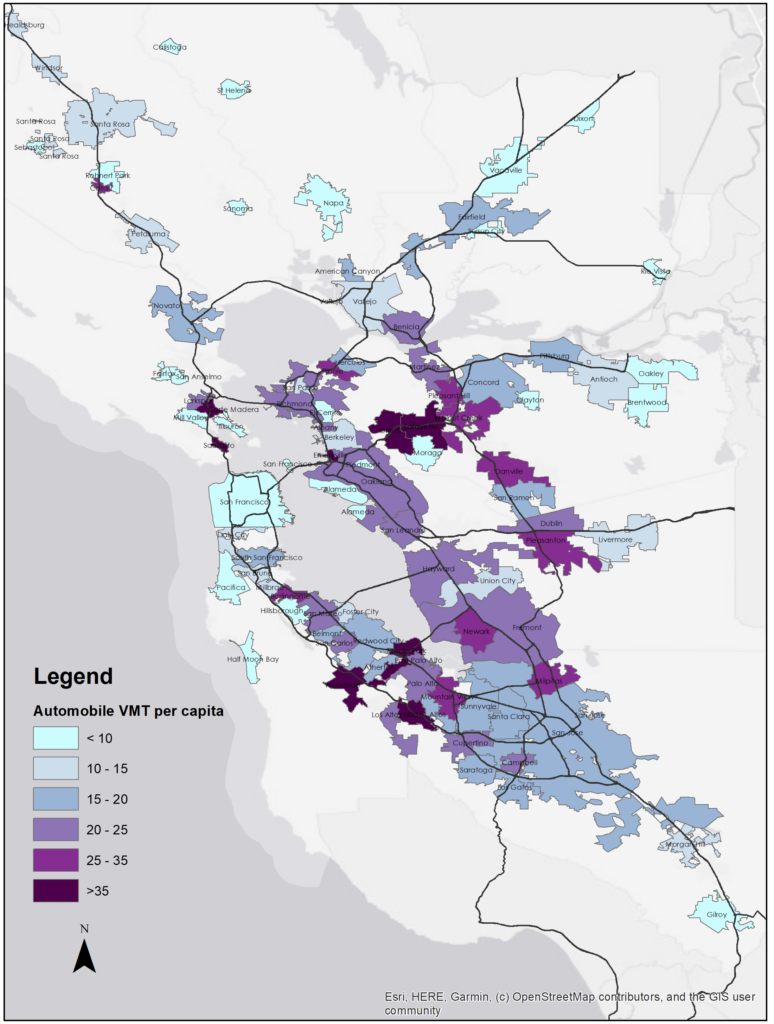
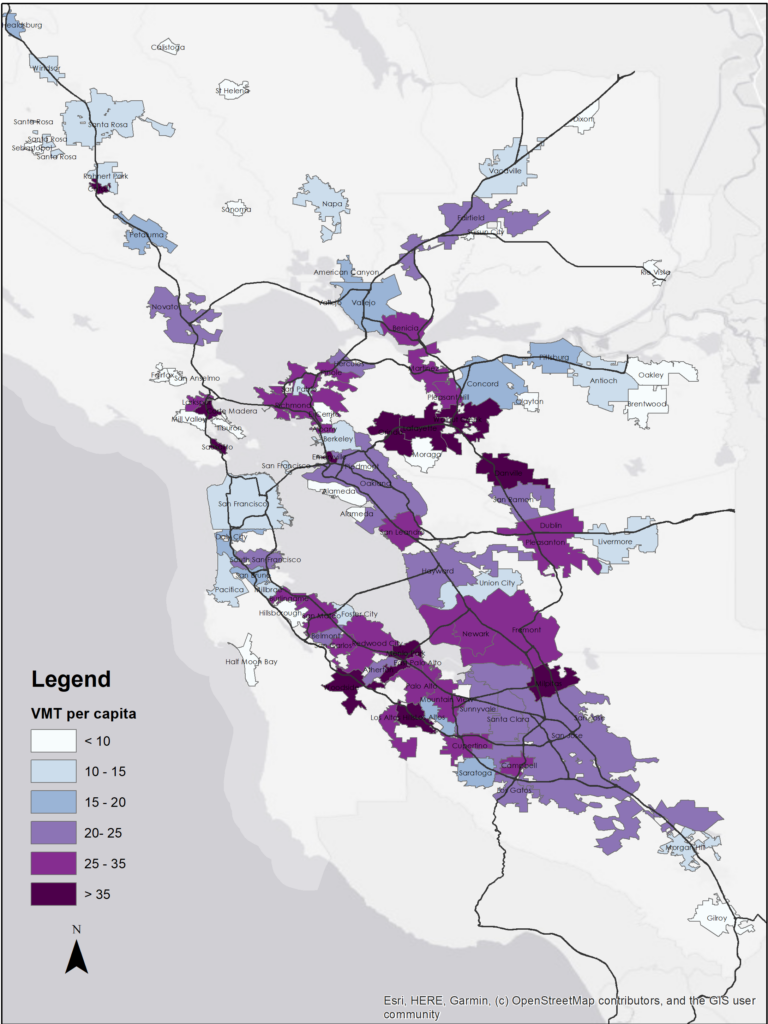
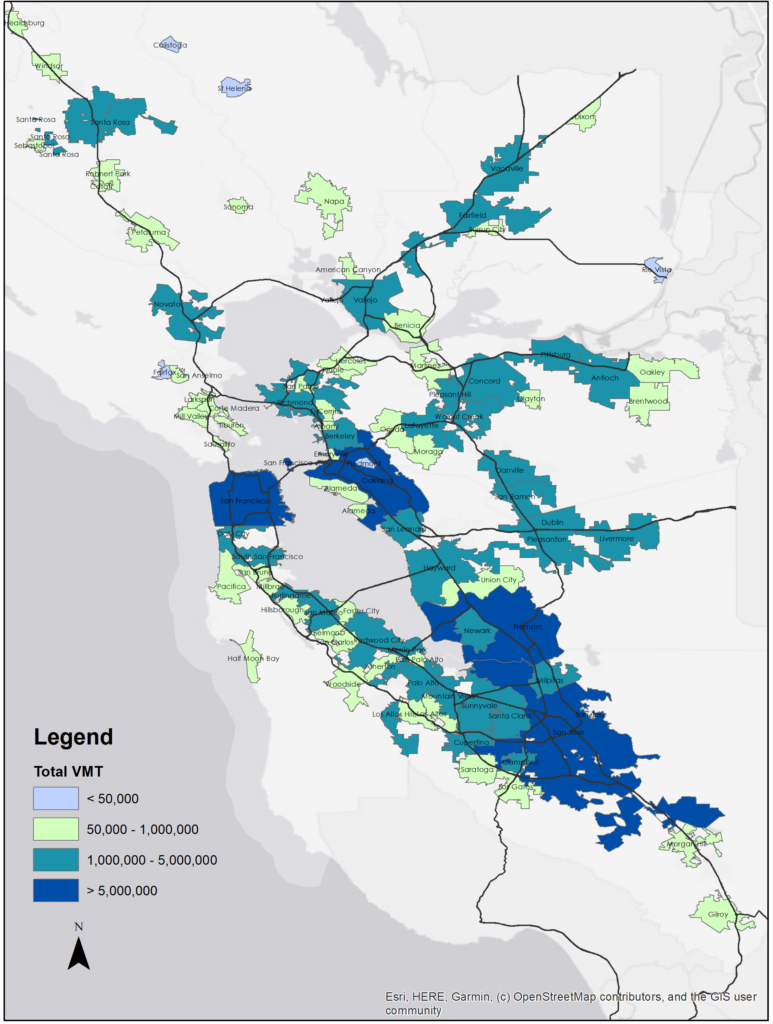
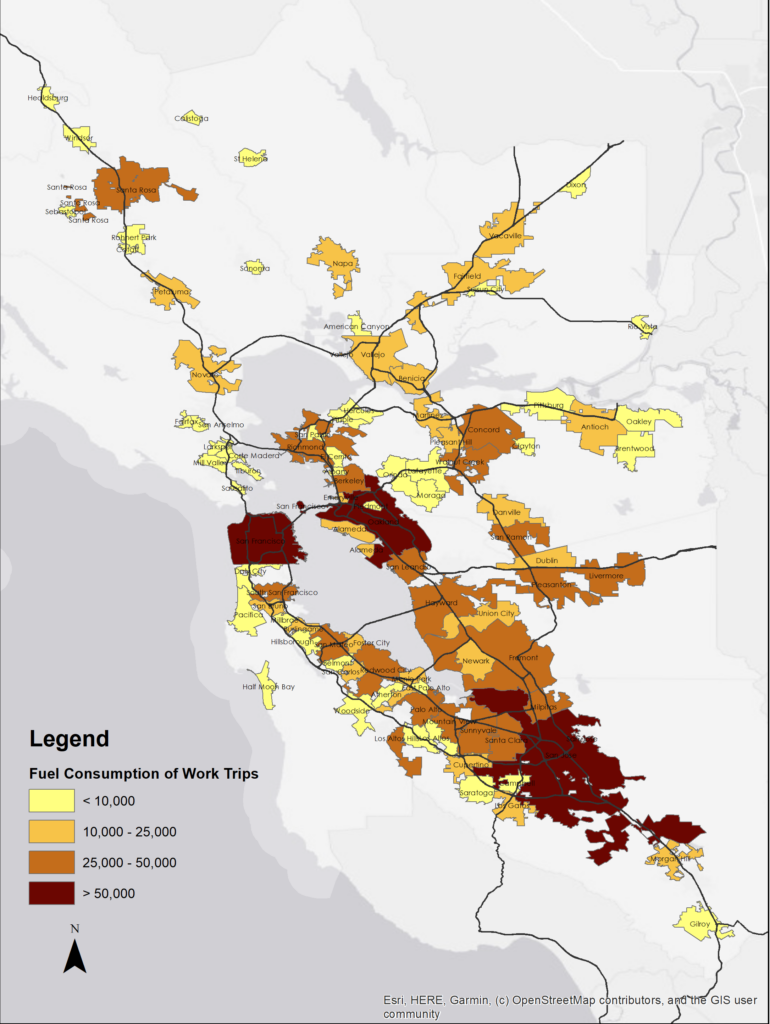
These figures show comparative results for 15 cities in the Bay Area including the simulated Per Capita Vehicle Hours Delay (VHD), Per Capita Vehicle Miles Travelled (VMT), and Per Capita Fuel Consumption city.

Challenge:

Vehicle Miles Travelled (VMT)

Automobile VMT Per Capita

personal auto vehicle miles travelled per capita for bay are

VMT Per Capita

all vehicle types vehicle miles travelled per capita for bay are

Total VMT

vehicle miles travelled for all cities in the bay area

Fuel Consumption of Work Trips

fuel used for work trips in bay area

Challenge:

Bridge Event/ Failure

Bay Bridge: EW Daily Commute

bay bridge bridge use pattern east to west

Golden Gate: South Bound

Golden Gate pattern south bound

Dumbarton: East Bound

Dumbarton use pattern east bound

San Mateo: West Bound

San mateo use pattern west bound

Challenge:

Socially- Aware Evaluation Framework for Transportation (SAEF)

Technological advancements are rapidly changing traffic management in cities. Navigation applications, in particular, have impacted cities in many ways by rerouting traffic.  We developed a multi-themed framework called Socially- Aware Evaluation Framework for Transportation (SAEF), which assists in understanding how traffic routing and the resultant dynamics affect cities. The results show that many neighborhood impacts, such as traffic load on residential streets and around minority schools, degraded with system optimal fuel-based routing in comparison to individual travel-time routing. The findings also show that all routing strategies subject the city’s disadvantaged neighborhoods to disproportionate traffic exposure.

San Jose

SAEF framework results for San Jose

San Francisco

SAEF framework results for San Francisco

Oakland

SAEF framework results for Oakland

Concord

SAEF framework results for Concord
Scroll to Top